
My Simple Data Storytelling Framework
Dataprincess To You ~ Letter 7

Hello you :)
Let’s talk about ‘talking data with people who don’t understand data.’ In other words, Data Storytelling ✨

Data storytelling is critical to our work as data professionals because our insights are valuable only if others understand them.
Yet, even the best data analysts struggle to consistently deliver their insights in a way that sticks.
That’s why I want to share my simple framework for telling compelling data stories without overthinking them.
I call it the CHART Framework.
Tell Better Data Stories with the CHART Framework
The chart framework helps you structure your data story.
But before you build a narrative based on this framework, you must first understand your audience and know what insights or metrics they care about.
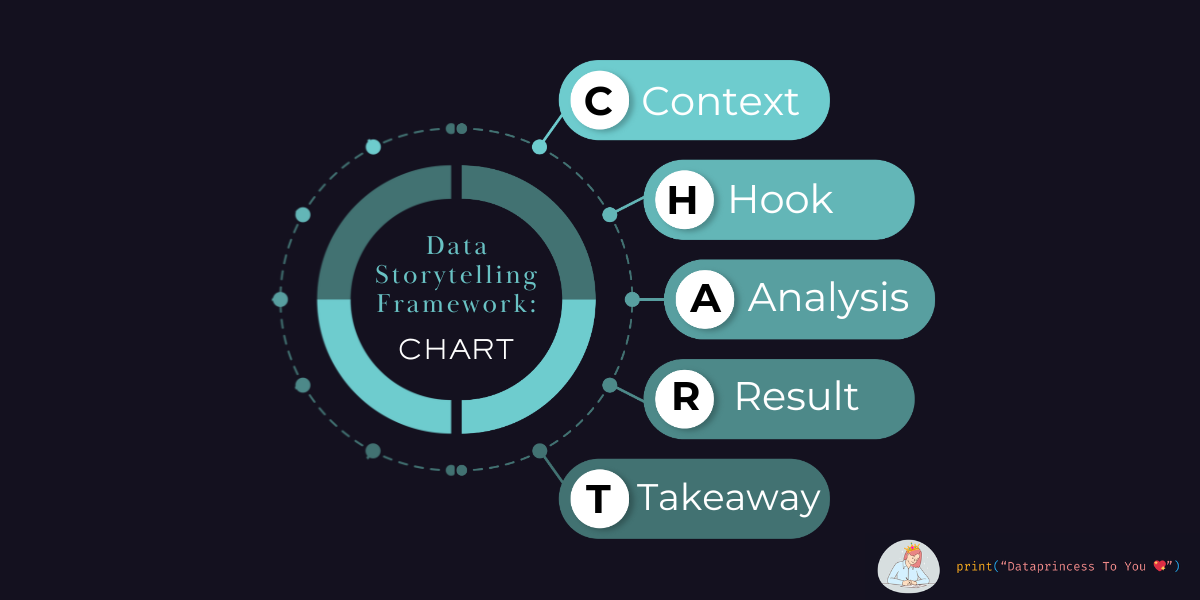
C— Context: Set the stage by explaining the background. Describe the situation or challenge that led to your analysis.
Example: “Our website traffic dropped by 20% after the redesign, which led to a significant drop in lead generation last month.”
H—Hook: Grab attention with a fact that makes your audience want to hear more. Your entire data story will revolve around this single insight.
Example: “But our model shows a potential 15% increase in leads if we restore just one key element from the old design.”
A—Analysis: Break down the numbers in clear, simple language. Avoid jargon and let the data speak for itself. Explain trends, comparisons, or outliers clearly, always linking back to the metrics that matter to your audience.
Example: “After the redesign, our homepage click-through rate dropped by 25%, while bounce rates increased by 40%. Users now spend 30% less time on key pages than before, and returning visitor rates have declined by 18%. The biggest drop-off happens on the homepage, where engagement time fell from an average of 1 minute to just 30 seconds. This proves the new layout is confusing users and making it harder for them to explore the site—and as a result, fewer visitors are reaching the sign-up page, leading to a drop in leads.”
R—Result: Show what the analysis reveals by summarizing the outcomes and how they can impact decisions or strategies.
Example: “After restoring key navigation elements, users spent 50% more time on the homepage, bounce rates dropped by 25%, and click-through rates returned to normal. More importantly, sign-ups increased by 15%, confirming that a clearer layout helps visitors navigate the site and convert into leads.”
T—Takeaway: End with a clear call to action or recommendation. Tell your audience what to do next.
Example: “We should return the old navigation and test a simpler layout. This will make it easier for visitors to explore the site and lead to more sign-ups and higher lead generation.”
BONUS Tip: Assertive body language, strategic pauses, and appropriate tone will spice up your data story even more.
There you go; with more practice, you’ll see you can never miss data storytelling with the chart framework :)
🚀Pro Tip for the Week
Good storytelling makes your findings more impactful. Read my 15 other Data Science Zens.
📚What’s Inspiring Me This Week
YouTube Playlist: Build an LLM From Scratch
Blog: 7 Seconds Conversation Fix, (which I will totally try at my next networking event).